
The figures, for the seven days up to July 27, are based on tests carried out in laboratories (pillar one of the Government’s testing programme) and in the wider community (pillar two). The rate is expressed as the number of new cases per 100,000 people. Listed for each Yorkshire area is the rate of new cases in the seven days to July 27; the number (in brackets) of new cases recorded in the seven days to July 27, followed by the equivalent figures for the seven days to July 20. Data for the most recent three days (July 28-30) has been excluded as it is incomplete and likely to be revised. Pictures are for illustrative purposes only.

1. Bradford
Bradford had a rate of 35 in the seven days to July 11, compared to 33.1 for the previous seven days to July 4

2. Kirklees
Kirklees had a rate of 26.7 in the seven days to July 11, compared to 34.9 for the previous seven days to July 4
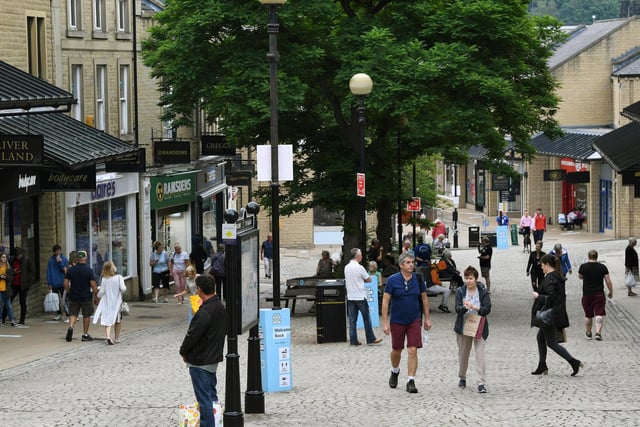
3. Calderdale
Calderdale had a rate of 19.5 in the seven days to July 11, compared to 11.9 for the previous seven days to July 4
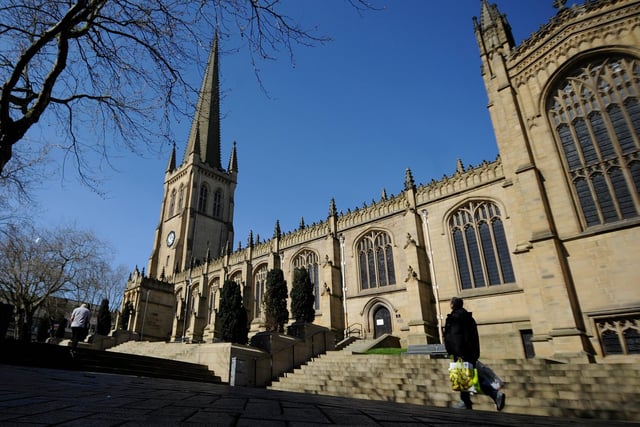
4. Wakefield
Wakefield had a rate of 16.5 in the seven days to July 11, compared to 12.2 for the previous seven days to July 4