
Eye-opening figures may make you reconsider your weekly supermarket shop: Sarah Coles
My family are apparently eating like millionaires. After every shop, once I’ve checked my supermarket receipt and recovered from the shock, I try to persuade them to give up lavish habits – like eating fruit – but they’re not keen.
This week I was able to show them that actually they’re eating like toffs, because we always spend more than £100 a week on food, and apparently only the top 10 per cent of earners spend this much (£104.20 to be exact). And while they tried to dismiss me as a sad case with a receipt obsession, knowing what you’re spending on the essentials can be very useful, for two reasons.
It can help to know how your spending compares to other, similar families. The Office for National Statistics Family Spending data calculates what we spend in an average week on everything. It’s apparently an average of £676.60 a week. However, spending varies dramatically across different household incomes. The lowest earning 10 per cent of people spend an average of just £231 a week and the highest earning 10 per cent spend £2,936. The 10 per cent who sit just below them spend an average of £1,913.
If you know roughly where your household income falls on the spectrum, you can get an idea of what people on a similar income to you are spending on specific things, and see whether, like me, you’re significantly over-ordering on the blueberry front. If you need to make budget cuts, it should also identify those areas where technically there’s room for manoeuvre.
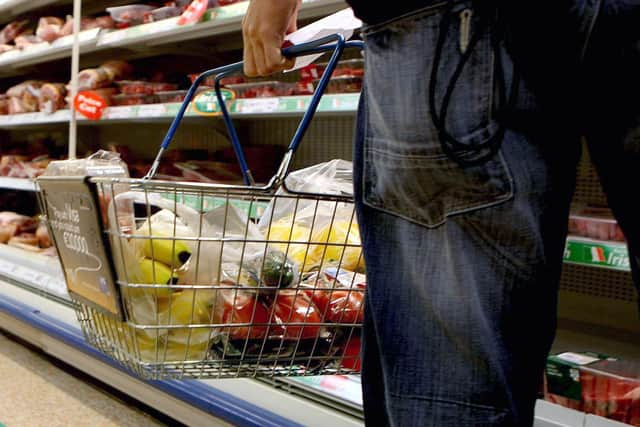

The ONS makes this easier by splitting people into five groups depending on their disposable income, and then weighting it, so they show the cost for a family of two people. This lets you factor in the extra costs of however many mouths you have to feed.
Within two-people households, the top 20 per cent spend £85.50 on food and non-alcoholic drinks, £94.80 on restaurants and hotels, £28 on clothes and shoes, £10.40 on phone services, £8.50 on TV subscriptions, £22.30 on petrol and £61 on rail and bus fares. The bottom 20 per cent, meanwhile, spend £61.80 on food and drink, £21.90 on restaurants and hotels, £11 on clothes and shoes, £6.50 on phone services, £4.70 on TV subscriptions, £10.30 on petrol and £1.40 on the bus. Meanwhile, the middle 20 per cent spend £74.70 on food and drink, £44.60 on restaurants and hotels, £17.30 on clothes and shoes, £9.80 on phone services, £6.10 on TV subscriptions, £20.80 on petrol and £1.60 on the bus.
If any of these figures seem surprisingly low for the kind of income bracket you think you might be in, it’s worth checking whether you’re paying over the odds, and if you could save by shopping around. In some cases, it may be that you’ve traded up more than people in your financial position usually do, so you need to consider whether it’s affordable.
It’s not just the every-day costs, because the data examines one-offs too. Holidays are a classic area of overspending. Both the richest and the poorest fifth of households spent much more on holidays in 2024/25 than they had a year earlier – with spending for the bottom 20 per ent up 66 per cent to £10.10 a week (£525.20 a year), and spending for the richest fifth of households up 22 per cent, to £61.20 per week (£3,182.40 a year). The average household spends £33.30 a week (£1,731.60).
It can be difficult to stick to these kinds of sums if you are taking your whole family away during the school holidays, which is why so many people will end up borrowing to pay for a break. Knowing what other people in a similar bracket to you are spending is a useful sense check to see whether your eyes are bigger than your wallet.
Getting to grips with what you’re spending on essentials is also a vital step in the process of working out whether you’ve got enough cash set aside for emergencies. Typically, while we’re working, we need enough emergency savings to cover 3-6 months of essential spending – rising to 1-3 years’ worth in retirement.
The official figures don’t divide spending into categories of essential and non-essential. However, according to AJ Bell analysis, the average household spent £641 a week (£2,778 a month) on things like mortgages, household bills, insurances, tax, communications and transport, so that’s a decent place to start. If we assume that cost-cutting within these categories can trim 20 per cent off the cost, that’s reduced to £2,222 a month. It means your rainy-day savings should ideally be between £6,666 and £13,332.
There will be people still building their emergency savings, who will be rightfully annoyed that as they get closer to the target, it feels like the goalposts are being moved. If these goals feel like a real stretch, don’t be put off from making a start. Just put away what you can afford, as soon as you can afford to do so, and focus on what you can manage, rather than on what you can’t.
There will be others who already have emergency savings, for whom this is a timely reminder that they are very likely to need topping up. The cost of essentials is up from £2,572 a month back in 2023/24 – and trimmed by 20 per cent that was £2,058. Someone with these costs might currently have an emergency fund of between £6,174 and £12,348. It means they might need up to another £984 in savings.
It’s also worth revisiting where your cash is stashed. In a competitive easy access savings account, they can currently more than keep pace with inflation, so the interest rate will be doing some of the hard work for you.
Of course, all these figures are averages, and there’s no such thing as an average family, so it’s worth doing the sums for your own spending. Who knows, if you can persuade your family to cut back on blueberries, you might protect yourself from needing to save another penny after all.
Fewer children
Figures out last week revealed that we’re having fewer children. Women born in 1979 had 1.95 children by the age of 45 and men had 1.82 on average, and as time goes on, younger generations are expected to have even fewer.
To keep a steady population in the absence of migration, couples need to have 2.1 children on average. In 2024, the average Brit is already having fewer than two, and when you add in the fact we’re living longer on average, there are serious implications for the state pension.
The state pension is funded by the taxes paid by working people at the time, so when the number of younger people is set to drop and the number of pensioners is forecast to rise, it creates an imbalance. If the government does nothing, it means fewer working people paying for the state pensions of more older people. The triple lock will also mean those pensions keep growing, which is likely to lead to a rise in taxes for working age people and an impact on broader public services.
The government could raise the state pension age again, but without improvements in health at older ages, this may mean more people relying on working age benefits later in life. Policymakers could also make changes to the triple lock, but that would be politically difficult. They also have the option of considering immigration policies for working age people. What’s clear from the figures, however, is that some kind of change is eventually inevitable.