Yorkshire house prices: The areas of Yorkshire where the average house price has risen the most
Most of the places which have lost the most value are in London, according to Halifax.
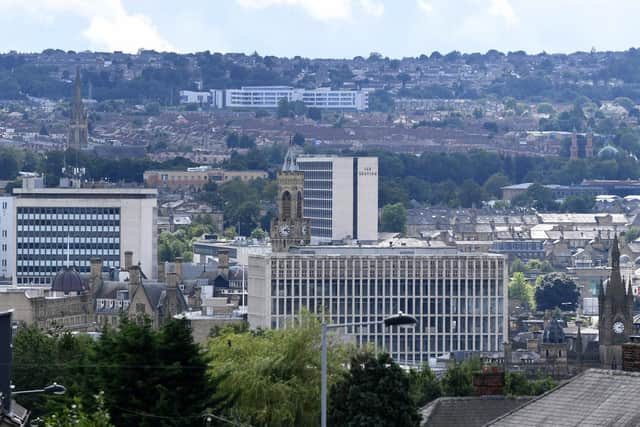
Bradford was 11th on the list of the top 20 places that have seen the highest increase in house prices, with an average house price of £170,684 - up by £23,323, or more than 15 per cent.
Advertisement
Hide AdAdvertisement
Hide AdScunthorpe was 18th, rising £21,986 to £176,186 followed by Doncaster which rose by £25,096, or 14.2 per cent, to £201,824.

Across Yorkshire and the Humber, average house prices are up by more than 10 per cent (£21,695) to £231,553.
Taunton in Somerset has been identified as the UK’s top house price hotspot in 2021, with property values there increasing at more than three times the national average rate.
Over the past year, average house prices in Taunton have increased by more than a fifth (21.8%), compared with a 6.2% increase across the UK generally, Halifax said.
Advertisement
Hide AdAdvertisement
Hide AdIn cash terms, the average house price in Taunton, which has a range of independent shops and is surrounded by attractive countryside including the Quantock Hills, rose by £56,546 to £315,759.

With its good links to the M4 and rural surroundings, the Wiltshire town of Chippenham has also benefited from the “race for space” among buyers, with the biggest increase in house prices in cash terms.
Prices there rose to an average of £381,181 – marking an increase of £58,322 since 2020.
Nowhere in London appeared in the top 20 hotspots list. The area of the capital with the highest growth was Enfield, where the average house price increased by 6.8% to £512,135.
Advertisement
Hide AdAdvertisement
Hide AdWestminster in central London recorded the biggest fall of any area, with average house prices there down by 6.9%.
Russell Galley, managing director, Halifax, said: “As the county town of Somerset, this year’s house price winner, Taunton, has a lot to offer home-buyers with its high quality of life and great transport links to major towns and cities across the South West.
“Like Taunton, many of the areas that saw the biggest house price growth over the last year enjoy a combination of greater affordability and space compared to nearby cities.
“Places like Bolton, Newark, Bradford and Hamilton – where there are a broad range of property types and settings – all offer significantly better value than their more metropolitan neighbours.”
Advertisement
Hide AdAdvertisement
Hide AdMr Galley added: “This is perhaps most clearly shown in the UK’s capital. It is rare that no London boroughs appear amongst the areas of highest house price growth but that is the case in 2021.
“This shift echoes what we have seen from home-buyers over the last year – less focus on major cities and more demand in the suburbs and further afield.”
– Here are the top 20 hotspots with the highest growth in the average house price over the past year, according to Halifax, with the average house price now and the one-year change in cash and percentage terms:
1. Taunton, South West, £315,759, £56,546, 21.8%
2. Newark, East Midlands, £280,934, £46,732, 20.0%
3. Rochdale, North West, £206,098, £32,123, 18.5%
4. Chippenham, South West, £381,181, £58,322, 18.1%
5. Braintree, South East, £356,216, £54,236, 18.0%
6. Widnes, North West, £222,876, £33,628, 17.8%
7. Motherwell, Scotland, £177,118, £26,103, 17.3%
8. Bolton, North West, £212,671, £30,818, 16.9%
9. Hereford, West Midlands, £306,872, £44,336, 16.9%
10. Walsall, West Midlands, £230,972, £31,614, 15.9%
11. Bradford, Yorkshire and the Humber, £170,684, £23,323, 15.8%
12. Swansea, Wales, £211,590, £28,360, 15.5%
13. Kettering, East Midlands, £285,103, £36,783, 14.8%
14. Maidstone, South East, £370,964, £47,756, 14.8%
15. Newton Abbot, South West, £326,623, £42,014, 14.8%
16. Spalding, East Midlands, £264,668, £33,703, 14.6%
17. Wirral, North West, £276,042, £34,936, 14.5%
Advertisement
Hide AdAdvertisement
Hide Ad18. Scunthorpe, Yorkshire and the Humber, £176,186, £21,986, 14.3%
19. Doncaster, Yorkshire and the Humber, £201,824, £25,096, 14.2%
20. Hamilton, Scotland, £159,176, £19,225, 13.7%
– And here are the 20 coldspots with the lowest growth in average house prices, according to Halifax’s figures:
1. Westminster, London, £738,088, minus £54,809, minus 6.9%
2. Airdrie, Scotland, £150,874, minus £6,023, minus 3.8%
3. Hammersmith and Fulham, London, £716,541, minus £24,525, minus 3.3%
4. Coatbridge, Scotland, £145,880, minus £3,435, minus 2.3%
5. Islington, London, £716,554, minus £11,368, minus 1.6%
6. Kirkcaldy, Scotland, £157,663, £1,774, 1.1%
7. Oxford, South East, £482,893, £5,808, 1.2%
8. Croydon, London, £436,441, £6,502, 1.5%
9. Inverness, Scotland, £198,672, £3,137, 1.6%
10. Cambridge, East Anglia, £473,790, £8,600, 1.8%
11. Dartford, South East, £353,714, £6,616, 1.9%
12. Gravesend, South East, £356,196, £8,830, 2.5%
13. Stockton-on-Tees, North East, £190,736, £4,739, 2.5%
14. Waltham Cross, South East, £414,071, £10,863, 2.7%
15. Glenrothes, Scotland, £151,945, £4,695, 3.2%
16. Bexley, London, £416,390, £14,444, 3.6%
17. Waltham Forest, London, £530,176, £20,733, 4.1%
18. Havering, London, £428,012, £16,927, 4.1%
19. Sutton, London, £481,265, £19,529, 4.2%
20. Rochester, South East, £325,974, £13,499, 4.3%
Advertisement
Hide AdAdvertisement
Hide Ad– Here are price changes in Scotland, Wales, Northern Ireland and in England’s regions in 2021 as well as across the UK generally, according to Halifax, with the average price now followed by the one-year increase or decrease in cash and percentage terms:
Wales, £231,134, £28,454, 14.0%
Yorkshire and the Humber, £231,553, £21,695, 10.3%
East Midlands, £265,828, £24,375, 10.1%
East Anglia, £322,604, £27,790, 9.4%
Scotland, £207,778, £16,761, 8.8%
North West, £242,286, £18,373, 8.2%
Northern Ireland, £188,892, £13,364, 7.6%
South West, £329,110, £22,608, 7.4%
West Midlands, £266,659, £15,185, 6.0%
North East, £195,515, £10,837, 5.9%
South East, £420,042, £11,651, 2.9%
London, £554,684, minus £3,588, minus 0.6%
UK average, £323,355, £18,757, 6.2%